Part 1, Strategy 1
Action Item 1: Examine crime, arrest, and victimization data.
Why it matters
State policymakers need to understand reported crime, arrest, and victimization data at the state and local level to craft effective crime-prevention and public safety strategies. While index crimes show some of the most serious property and violent crime trends in a state, they omit a wide range of non-index crimes. Non-index crimes are all crimes other than the eight index crimes, such as drug offenses, weapon offenses, fraud, and driving under the influence (DUI), and account for the vast majority of arrests for crime—around 80 percent—in most states. States also need to consider how certain non-index crimes have changed over time.
The FBI’s UCR program goes beyond collecting data on arrests for index crimes to include data on 20 additional offenses, which contributes to a more complete picture of crime. However, arrest data has limitations. Because one person can be arrested for multiple crimes, multiple people can be arrested for a single crime incident, not all arrests result in convictions, and not all crime results in an arrest, arrest data doesn’t actually show how many people commit crimes or how much crime is committed.
Often an overlooked data source, victimization data offers valuable insight into the extent to which crime goes unreported, as well as about the demographics of people most impacted by crime. Reporting crime to police is a critical first step to investigation, prosecution, and accountability. Understanding the degree to which crime is unreported and how that has changed over time gives law enforcement agencies critical information that can inform changes to their policing practices and efforts to build community trust. (For additional information on how states can support law enforcement efforts to strengthen community trust, see Part 1, Strategy 4.) However, victimization data is rarely collected at the state or local level, and the federal government relies on a representative sample of households to estimate victimization trends nationally. To improve understanding of victimization trends, BJS redesigned the National Crime Victimization Survey in 2016 to produce state- and local-level victimization estimates for the largest 22 states.
What it looks like
- Analyze your state’s overall property and violent crime trends and how current crime rates compare to trends over the past decade.
- Assess changes in crime trends for individual types of property and violent crimes.
- Analyze overall arrest rates and changes in arrest rates for different types of crime at the state and local level.
- Analyze available victimization data to determine how much and what types of crimes haven’t been reported to police and how those trends have changed over time.
- Review how data trends have changed across different regions of the state, including across metropolitan, micropolitan, and rural areas.
Key questions to guide action
- How have crime, arrests, and victimization rates changed in your state over the past 10 years?
- Which types of crime are increasing in your state? Are crime rates rising or falling in urban areas? In rural areas?
- Is there a council, task force, or commission in your state comprising state and local criminal justice officials that regularly examines crime, arrest, and victimization trends and other public safety challenges?
Use the information that follows to inform your answers to these questions.
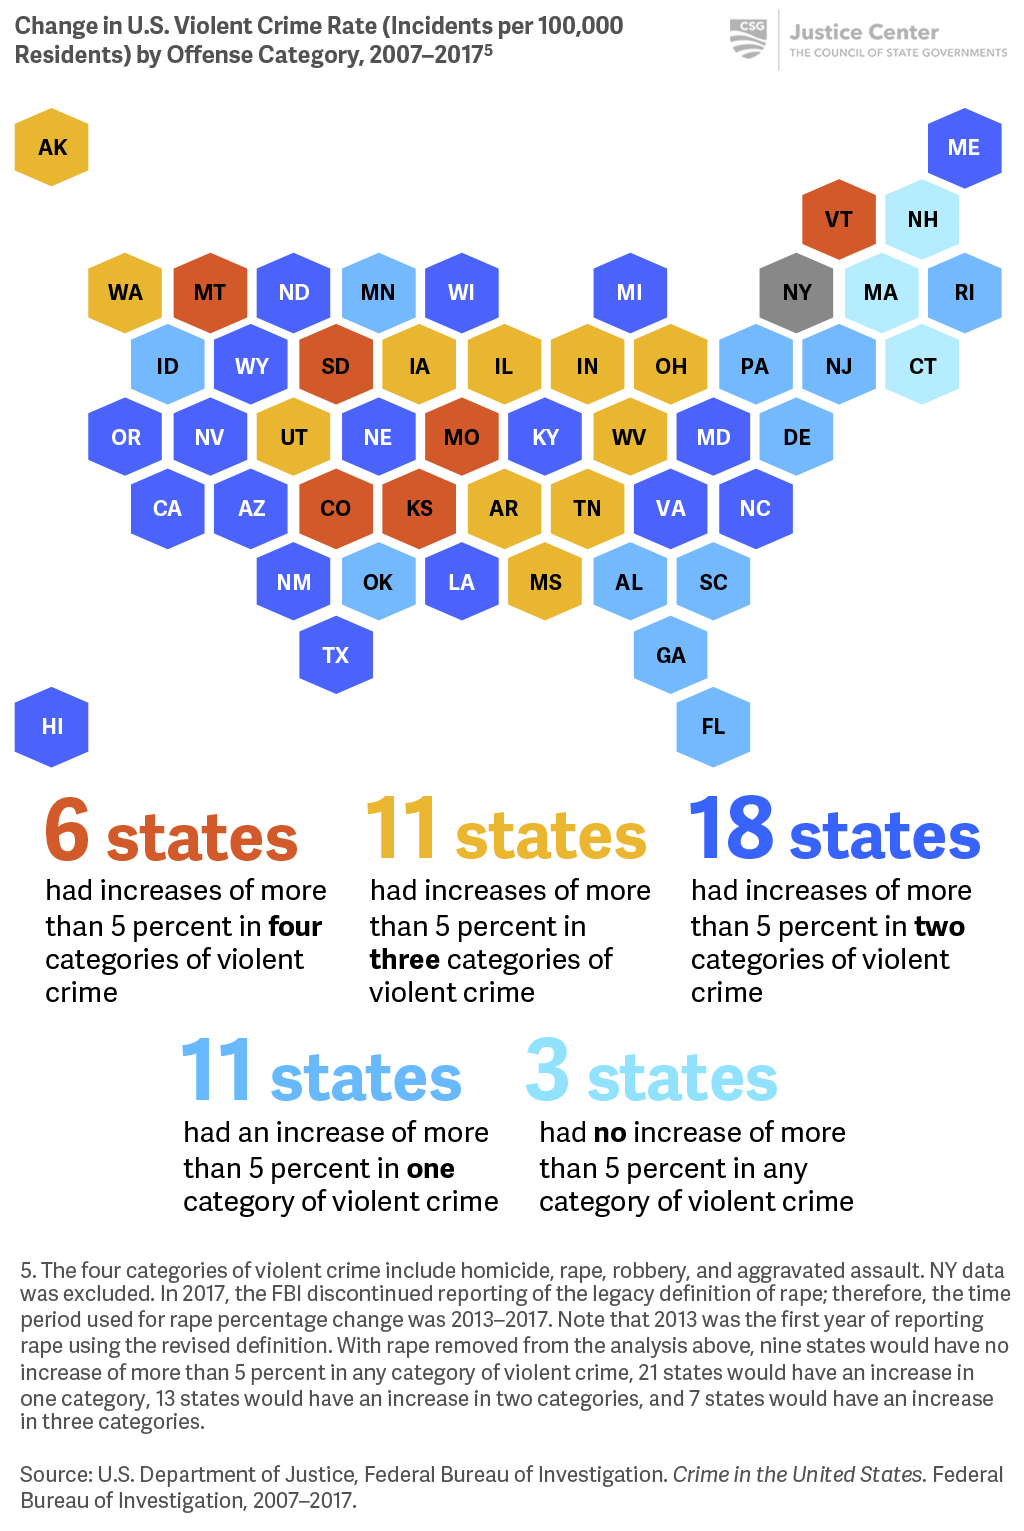
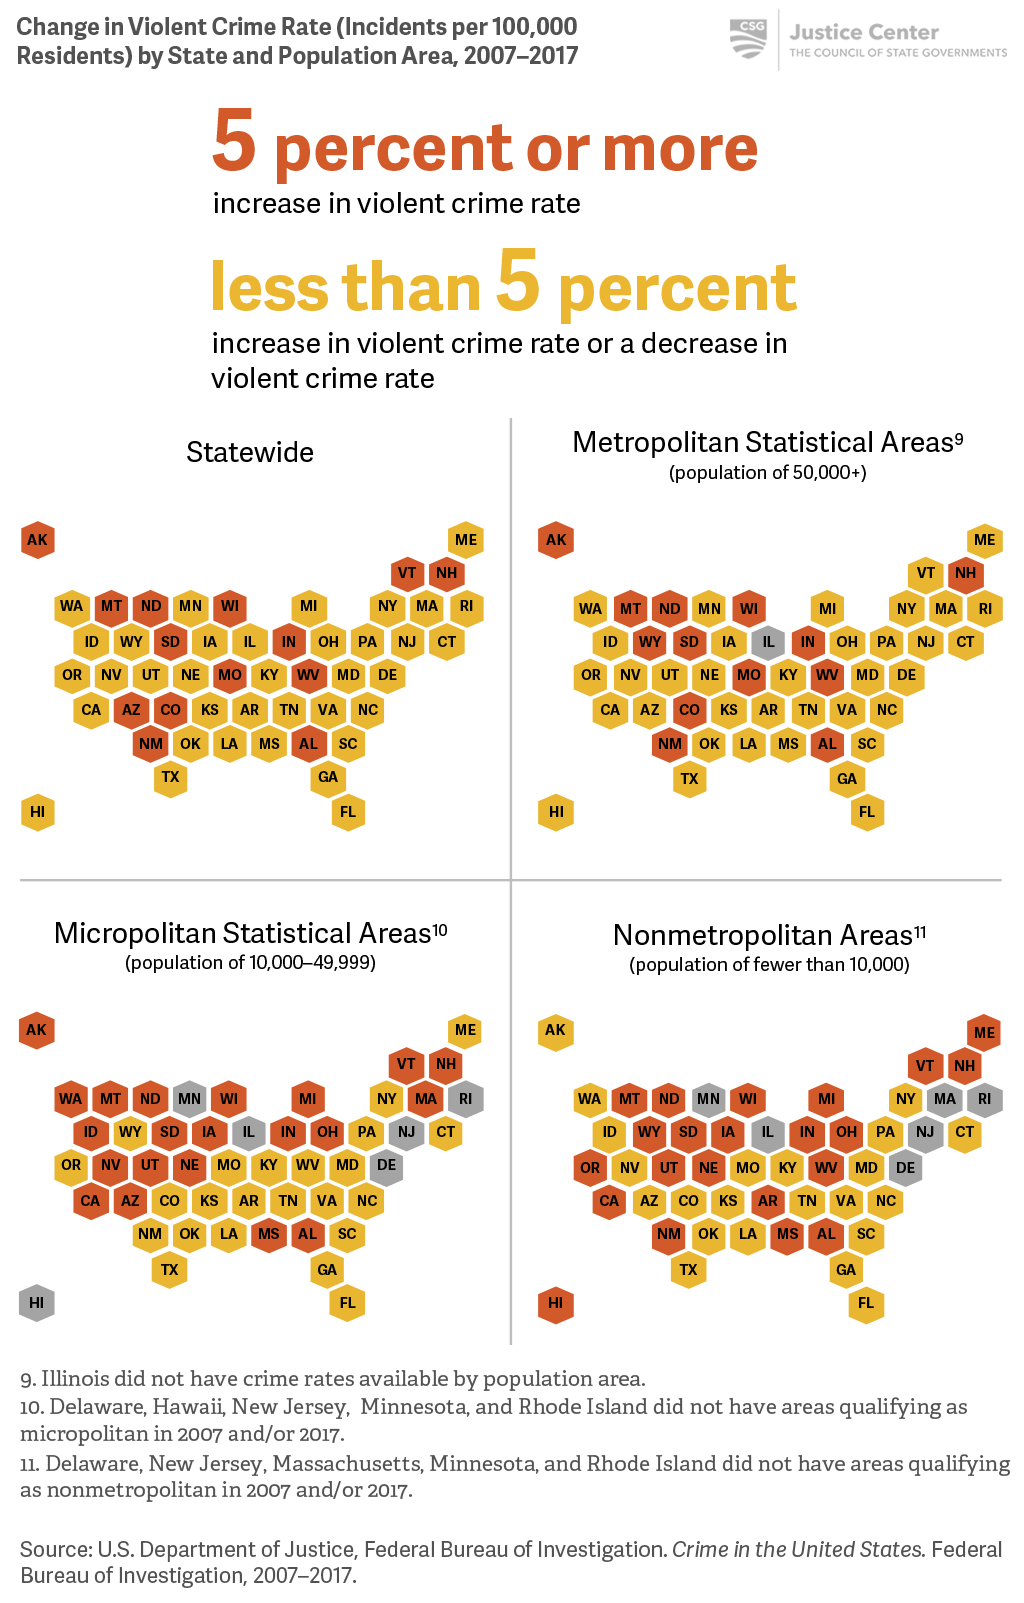
While only 19 states had increases in the rate of violent crime during the last decade, 46 states had increases of more than 5 percent in at least one of the four categories of violent crime.
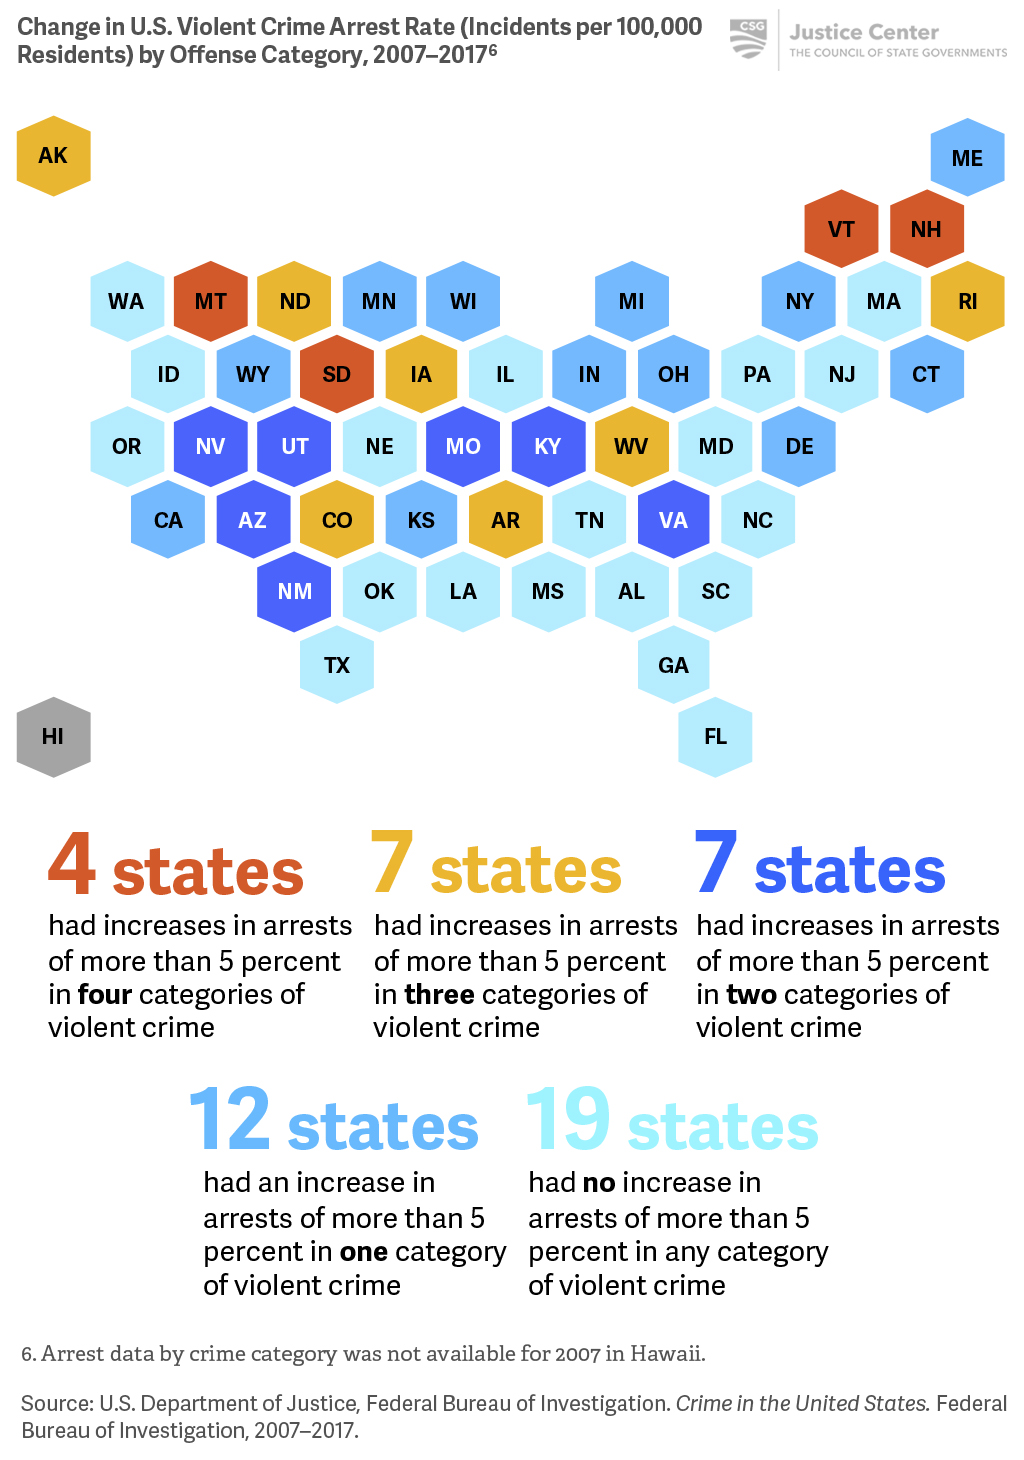
While arrests for violent crime increased in only 17 states in the past decade, 30 states saw arrests increase more than 5 percent in at least one of four categories of violent crime offenses.
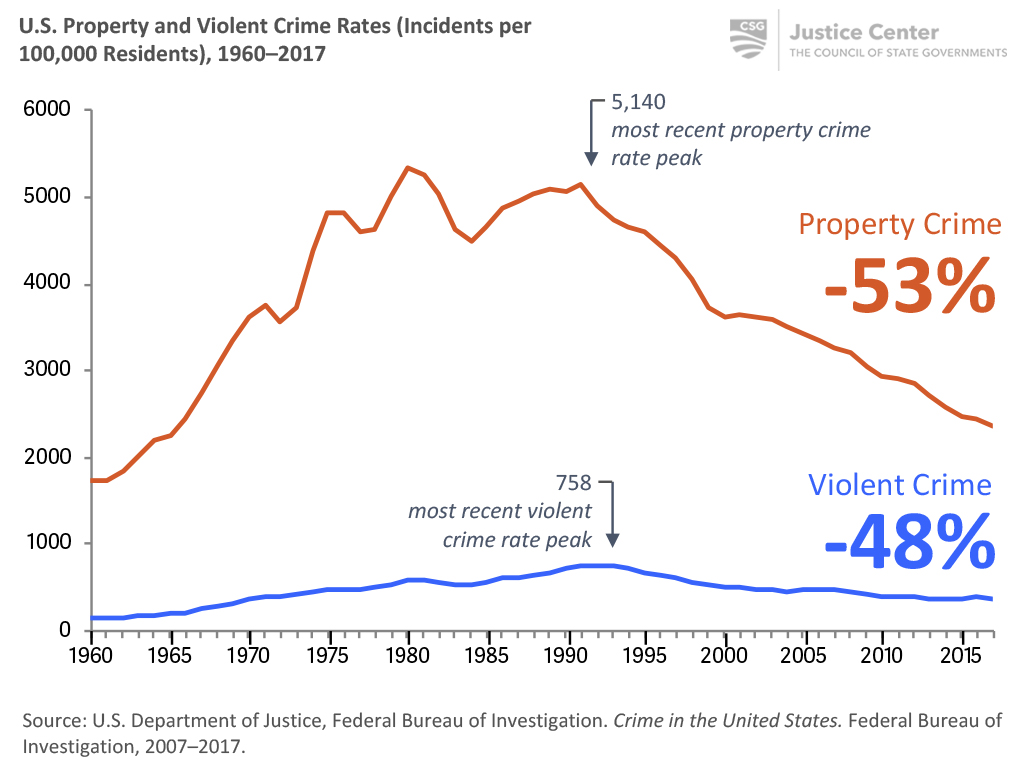
National property and violent crime rates have dropped 50 percent since their peak in the early 1990s.
All but four states have experienced a decline in the property crime rate since 2007.

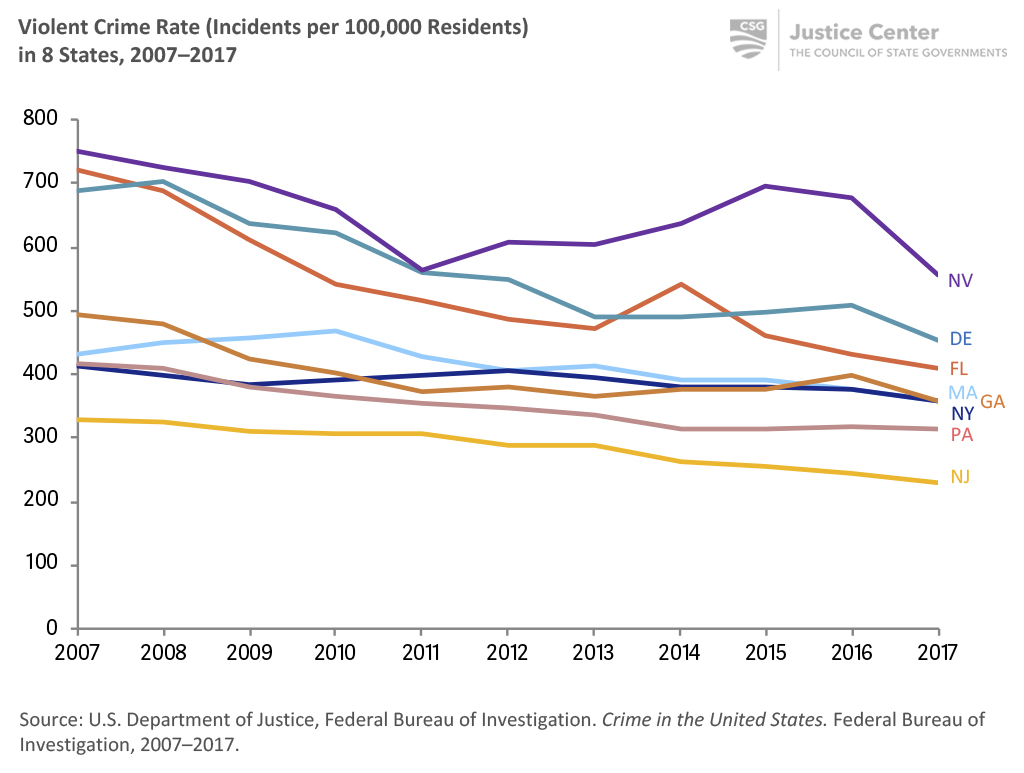
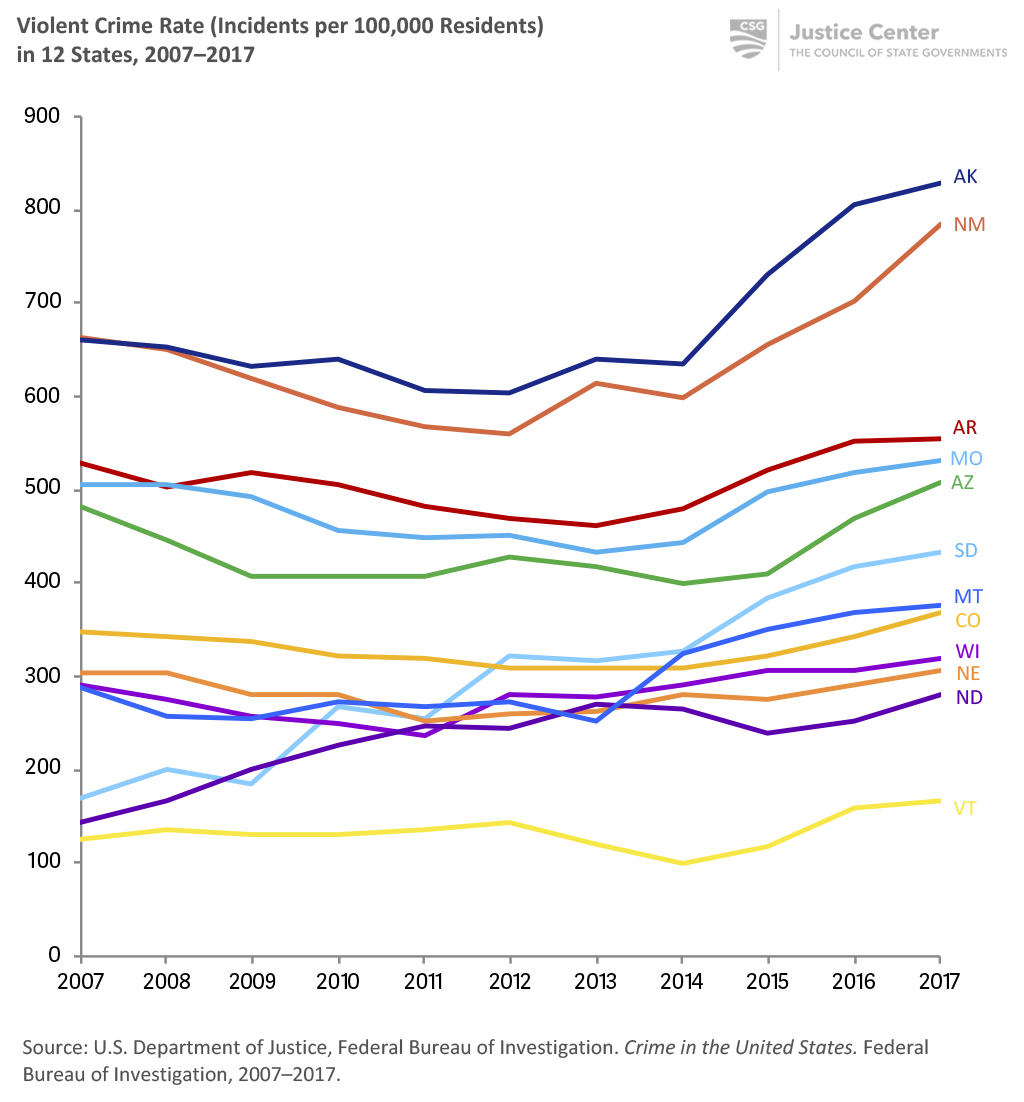
Violent crime rates increased in 19 states between 2007 and 2017, and the variation in violent crime rates across states is significant.

In 2017, the violent crime rate was at a 10-year low in 8 states.
In 2017, the violent crime rate was at a 10-year high in 12 states.
In 16 states, violent crime rates decreased overall, but increased in areas with fewer than 50,000 people.
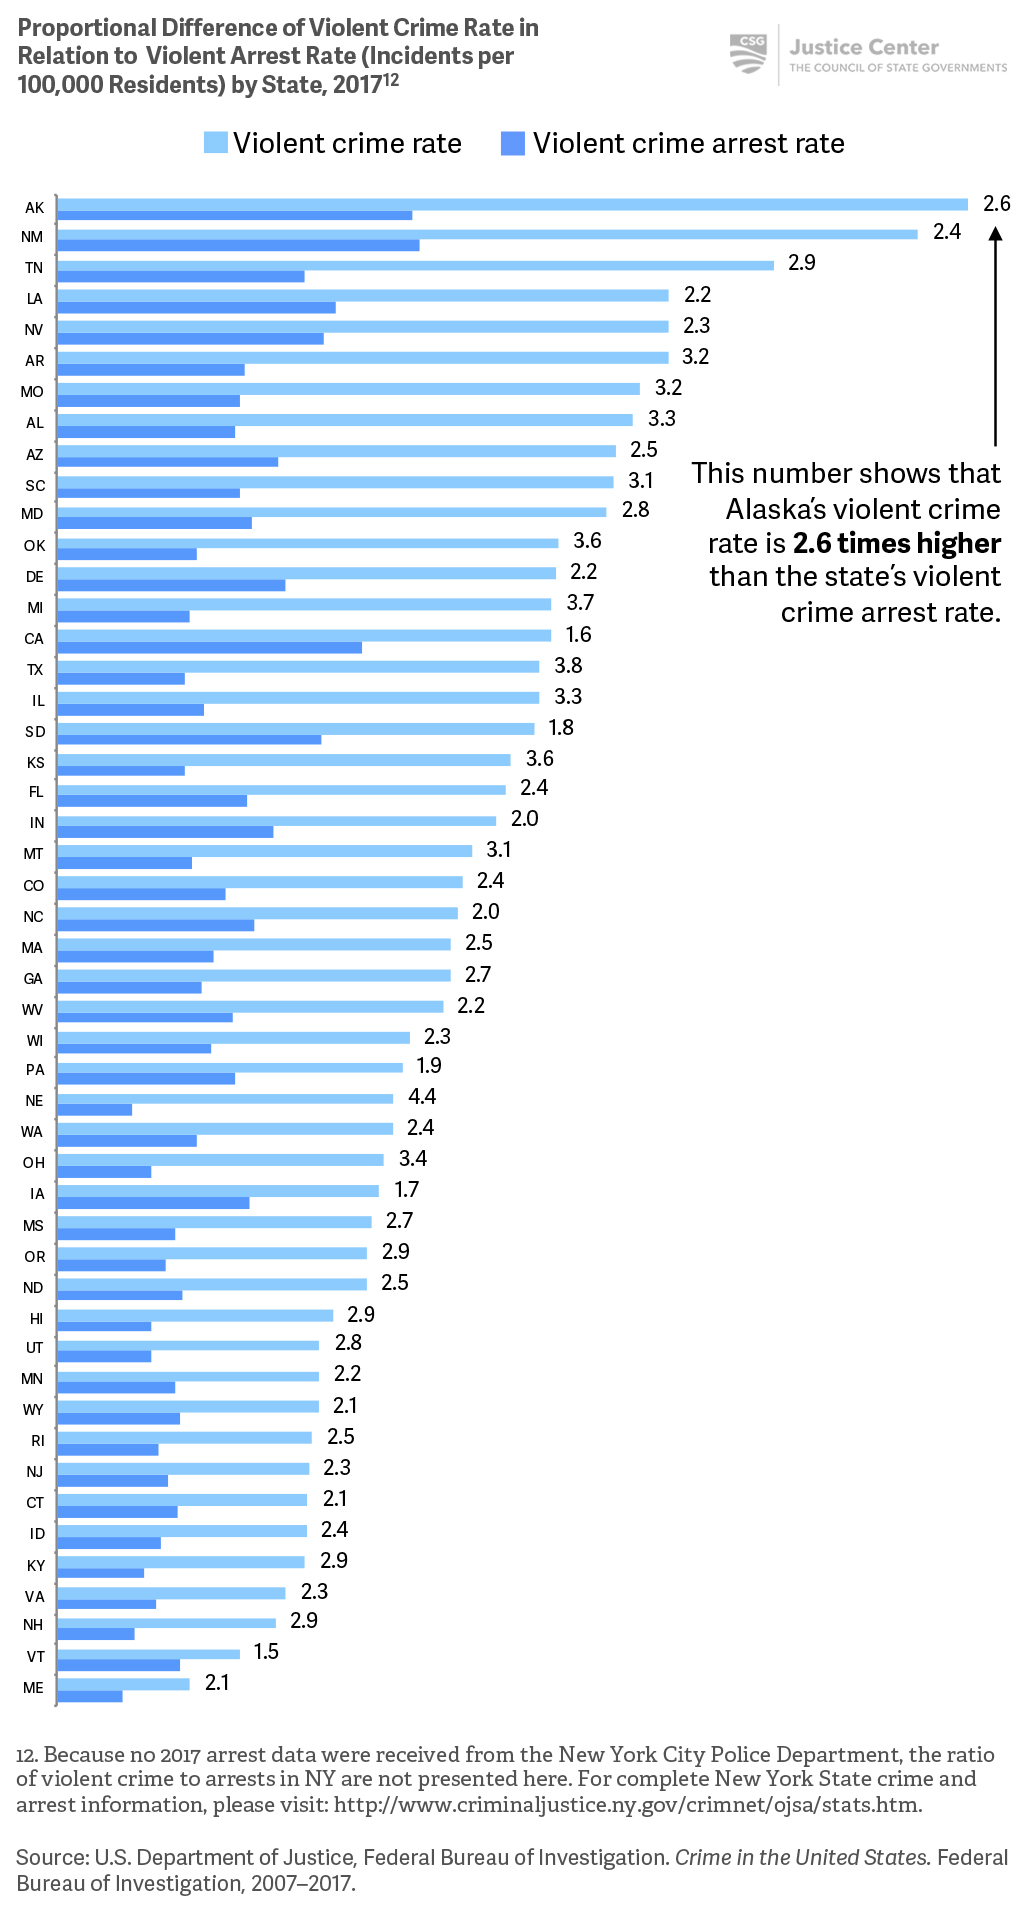
In 12 states, violent crime rates are at least three times higher than arrest rates for violent crime.
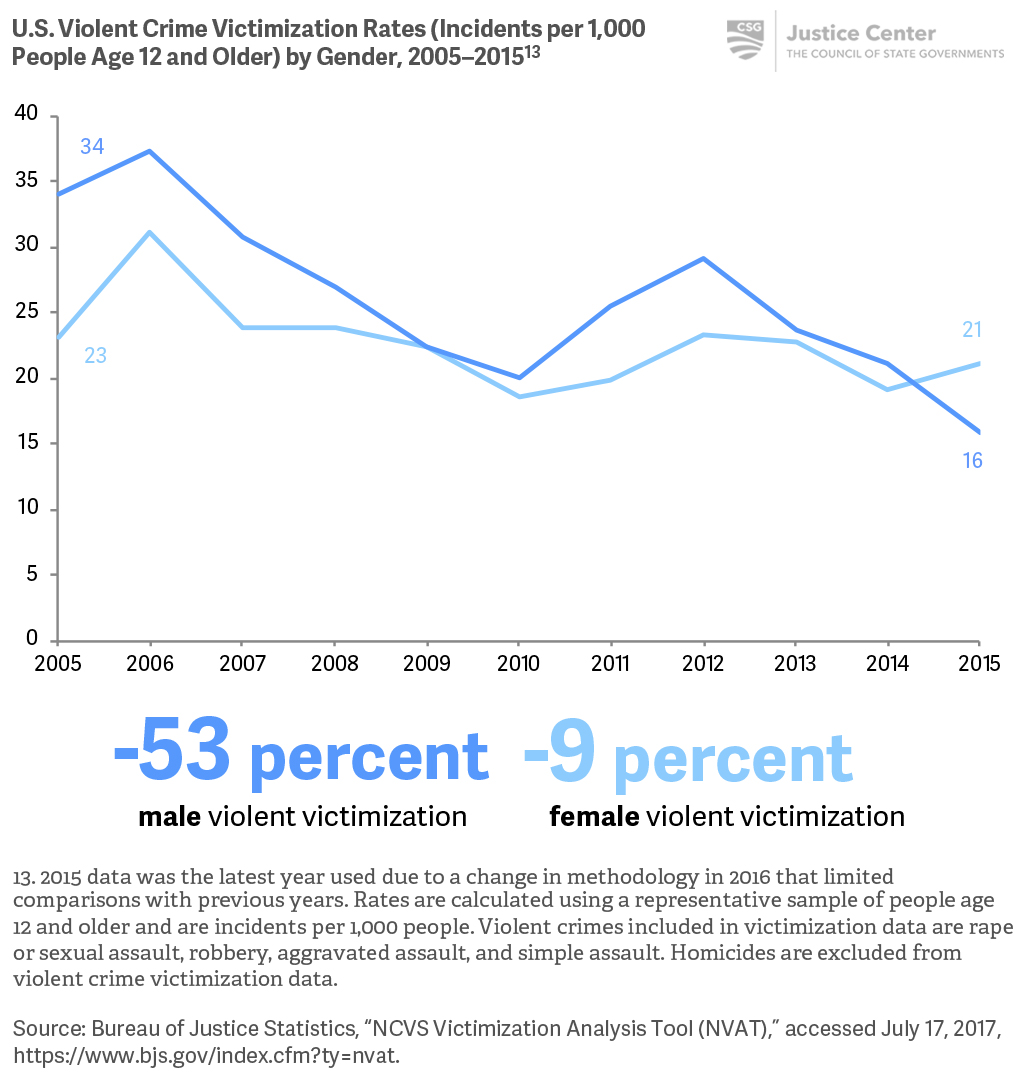
Male violent victimization rates have recently fallen below that of females for the first time since the early 1970s.
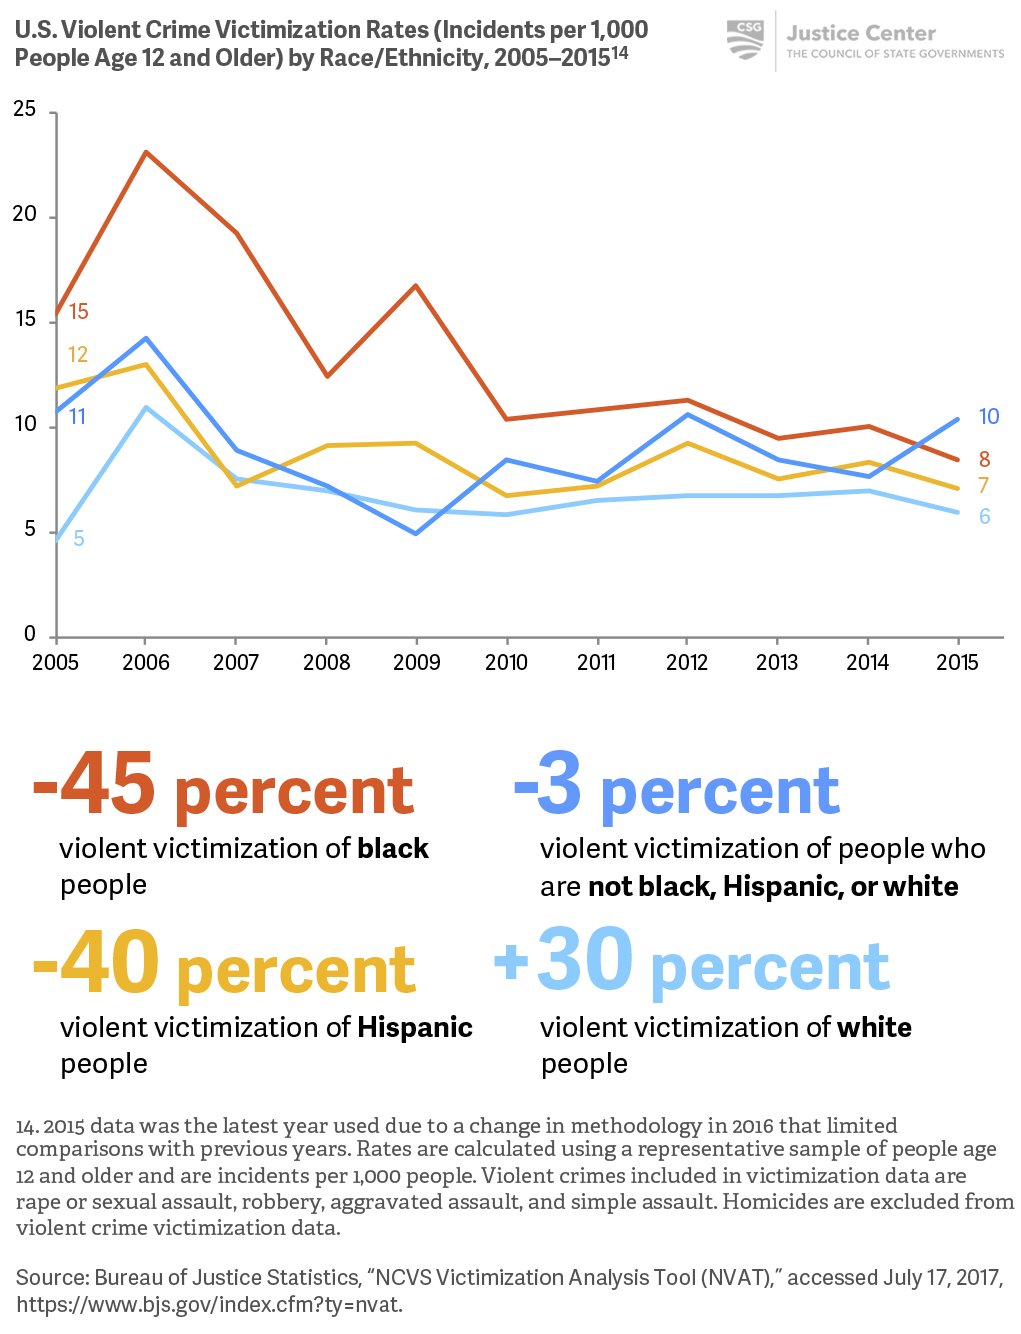
Although violent victimization rates for people of color decreased, people of color continue to experience higher rates of violent victimization compared to white people.
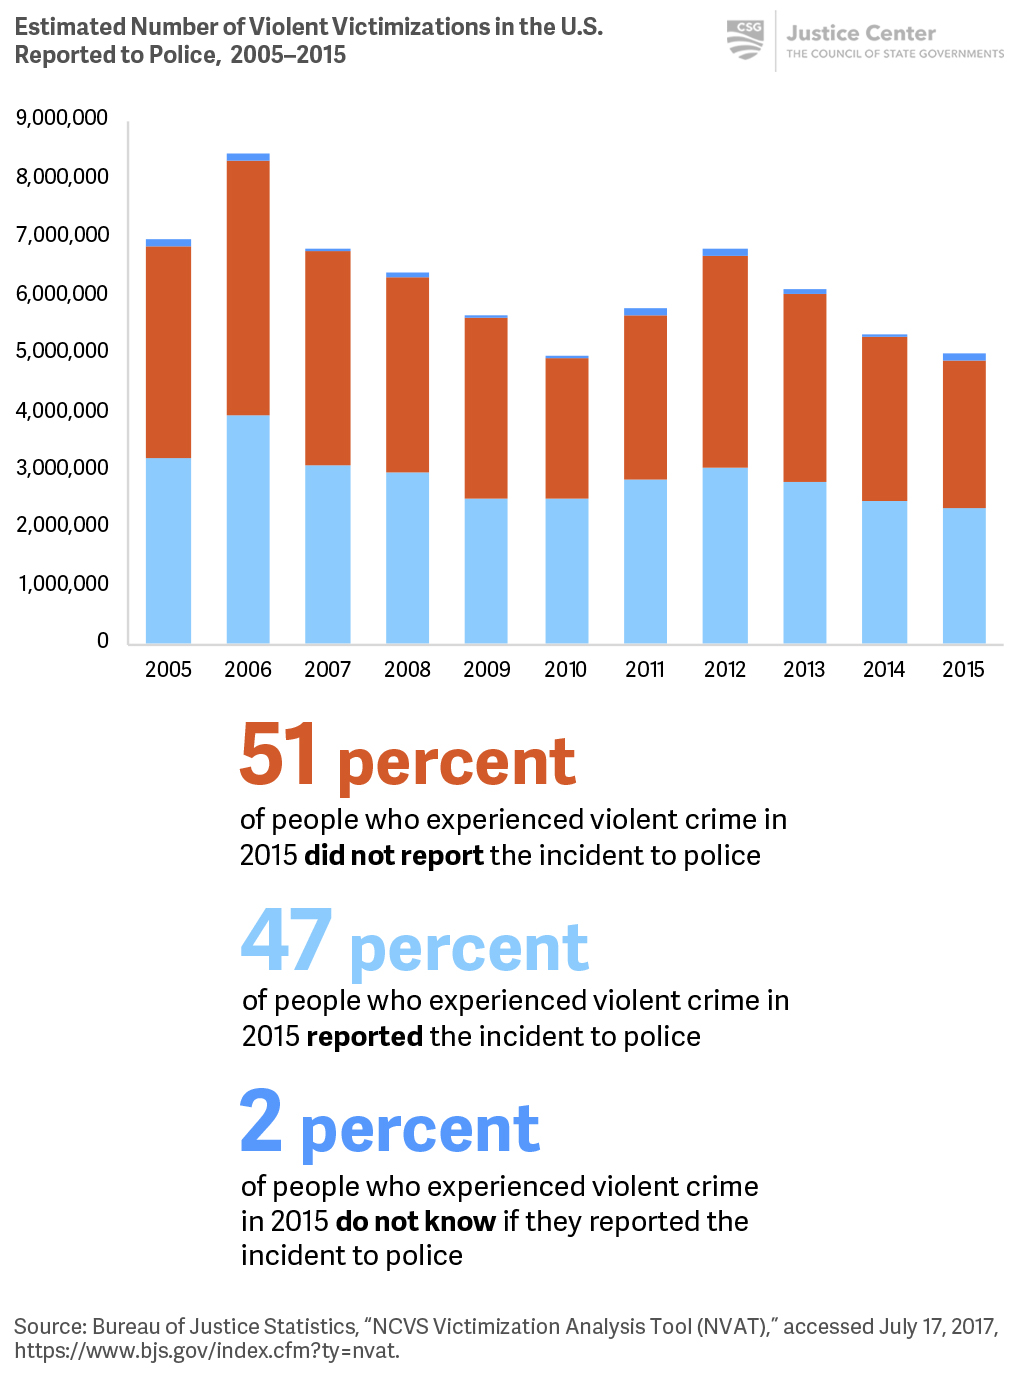
More than half of people who experience violent crime do not report these incidents to police.
Crimes are incidents reported by law enforcement to the FBI as part of the Uniform Crime Reporting (UCR) Program. Index crimes are considered representative of some of the most serious crimes, both violent and property. Violent index crimes are homicide and non-negligent manslaughter, forcible rape, robbery, and aggravated assault. Property index crimes are burglary, larceny-theft, motor vehicle theft, and arson. Index crimes do not include many common types of offenses, such as fraud, simple assault, and driving under the influence. Crime in this report refers only to reported index crime unless otherwise noted.