Part 1, Strategy 1
Action Item 2: Expand data collection metrics.
Why it matters
As state and local policymakers analyze reported crime, arrest, and victimization trends, they will likely uncover poor quality or limited data across all three categories of data. In many cases, agencies don’t have the data systems or processes in place to collect or share data. To understand crime trends, state and local leaders need to help law enforcement agencies improve their data collection and reporting procedures by using a more robust crime and arrest data system.
Local law enforcement can report crime data through either the UCR’s outdated Summary Reporting System (SRS) or through its more modern and robust National Incident-Based Reporting System (NIBRS). States can help improve collection of crime, arrest, and victimization data by ensuring that all law enforcement agencies report crime through NIBRS. (See additional resources box that follows for further information on NIBRS.)
Data on victimization can help states not only understand who is impacted by crime, but can also help determine the allocation of resources to address victims’ needs and repair harm. Since many victims don’t report crimes to law enforcement, statewide victimization surveys can be a vital way of identifying who has been impacted by crime and what services they may need. However, few states conduct them due to the expense and complexity of doing so. States can assess victimization trends for crimes reported to police by using NIBRS data, which can show demographic information about victims, injury types, and their relationship to the person who committed the crime. There are other ways to assess victims’ needs, such as conducting focus groups and analyzing victim service provider data, to identify gaps in services.
Demographic data associated with people who are arrested, convicted, and sentenced is necessary to understand whether and how much racial and ethnic disproportionality exists at each stage of the justice system. It can also show how different groups of people are victimized at varying rates. Two major issues in collecting and reporting race and ethnicity data are how a person’s race and ethnicity are captured (i.e., self-reported or determined by an intake officer) and how they are reported (i.e., race and ethnicity are separate or combined). Without state-level policies, local agencies are left to decide whether and how to collect this information.
What it looks like
- Require all law enforcement agencies to participate in NIBRS, and provide funding, as needed, to support this effort.
- See Case Study: States reduce barriers for law enforcement to participate in NIBRS
- Collect and report on victimization data.
- See Case Study: Washington State collects data to address gaps in victims’ services
- See Case Study: Iowa works with victims’ service providers to meet victims’ underserved needs
- Require law enforcement, courts, corrections, and supervision agencies to collect and report on demographic information.
- See Case Study: States improve reporting on demographic data for arrests
Key questions to guide action
- What kind of demographic information does your state require to be collected and reported on when people are arrested, sentenced, admitted to incarceration, or start supervision?
- How does your state identify who has been impacted by crime and assess gaps in services for victims?
- What are the key challenges preventing local law enforcement agencies in your state from participating in NIBRS?
- Do your state’s public safety agencies have the staffing and data systems necessary to support comprehensive data collection and reporting?
Use the information that follows to inform your answers to these questions.
Transitioning to the National Incident-Based Reporting System (NIBRS) from the Summary Reporting System (SRS) can help enhance crime and arrest reporting.

Additional Resources
Participating in the National Incident-Based Reporting System
Data metrics reported to the FBI through its Uniform Crime Reporting Program’s (UCR) Summary Reporting System (SRS) have remained largely unchanged since it was established in the 1930s. Recognizing that more sophisticated analyses can only be conducted with more robust data, in 1991, the FBI created and began using a more thorough collection and reporting method called the National Incident-Based Reporting System (NIBRS).
SRS reports on 10 offense classifications and reports only the most severe offense that occurred in an incident, while NIBRS reports on 52 offense classifications and reports on multiple offenses that occurred in one incident. For example, if an incident involving murder, robbery, and motor vehicle theft occurred, only the homicide would count under SRS since that is the most severe offense that occurred at that time. Under NIBRS, each of these offenses would be reported, as well as other information, including demographics, victim information, a description and value of property, and whether a weapon was used.
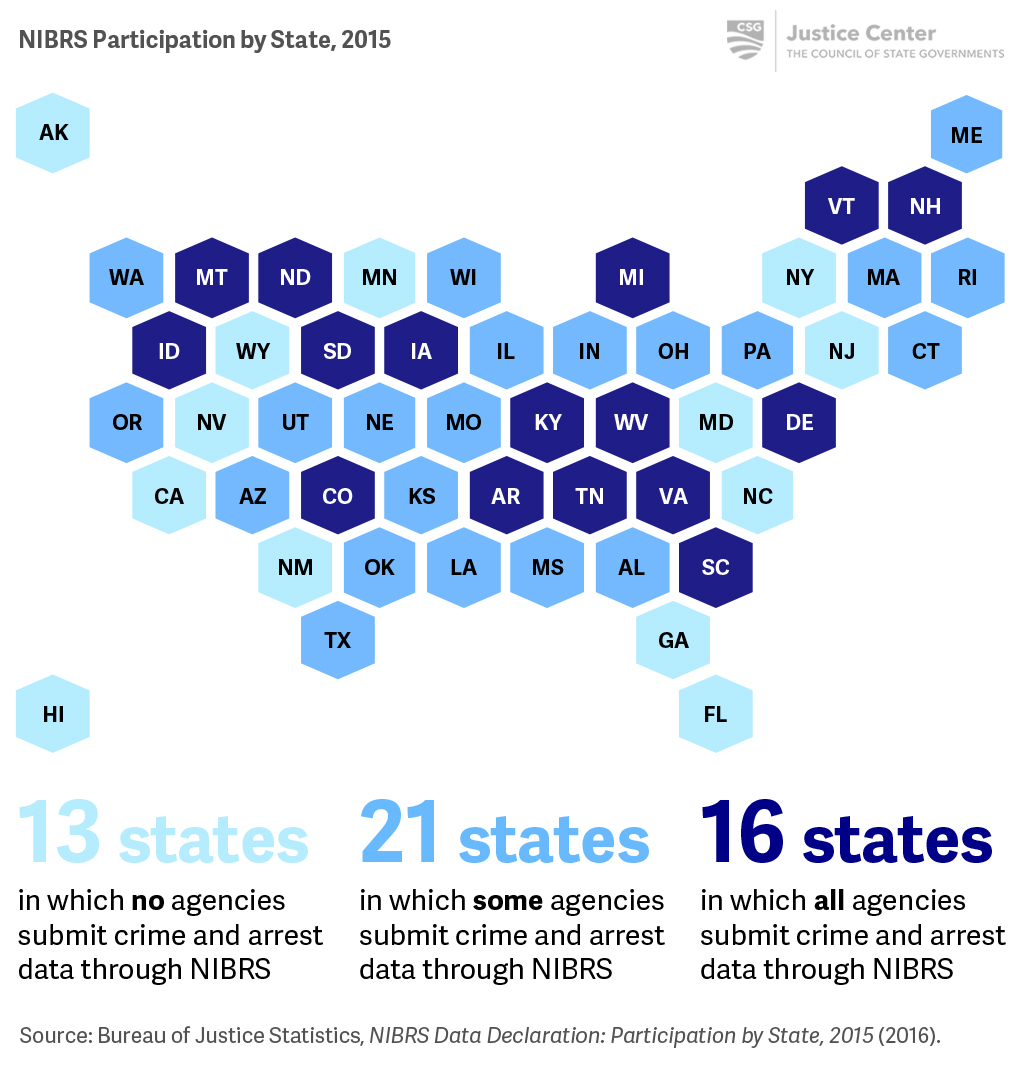
Despite federal notifications to local law enforcement agencies that the FBI will transition to NIBRS-only data collection by 2021, adoption of the NIBRS system in states has been slow. By 2015, only 16 states had 100 percent of local law enforcement agencies reporting crime and arrests through a NIBRS-certified system. Law enforcement agencies report a number of challenges in switching from SRS to NIBRS, including high costs associated with software and IT infrastructure upgrades, training needs, and staff capacity to handle data entry and oversight.
To address these challenges, the federal Bureau of Justice Statistics (BJS) in partnership with the FBI, has provided grant support to facilitate the conversion from SRS to NIBRS, through their National Crime Statistics Exchange program, which aims to increase the number of law enforcement agencies reporting through NIBRS.
Since NIBRS was implemented in 1991, only 16 states have converted all local law enforcement agencies to this system for reporting crime and arrests.
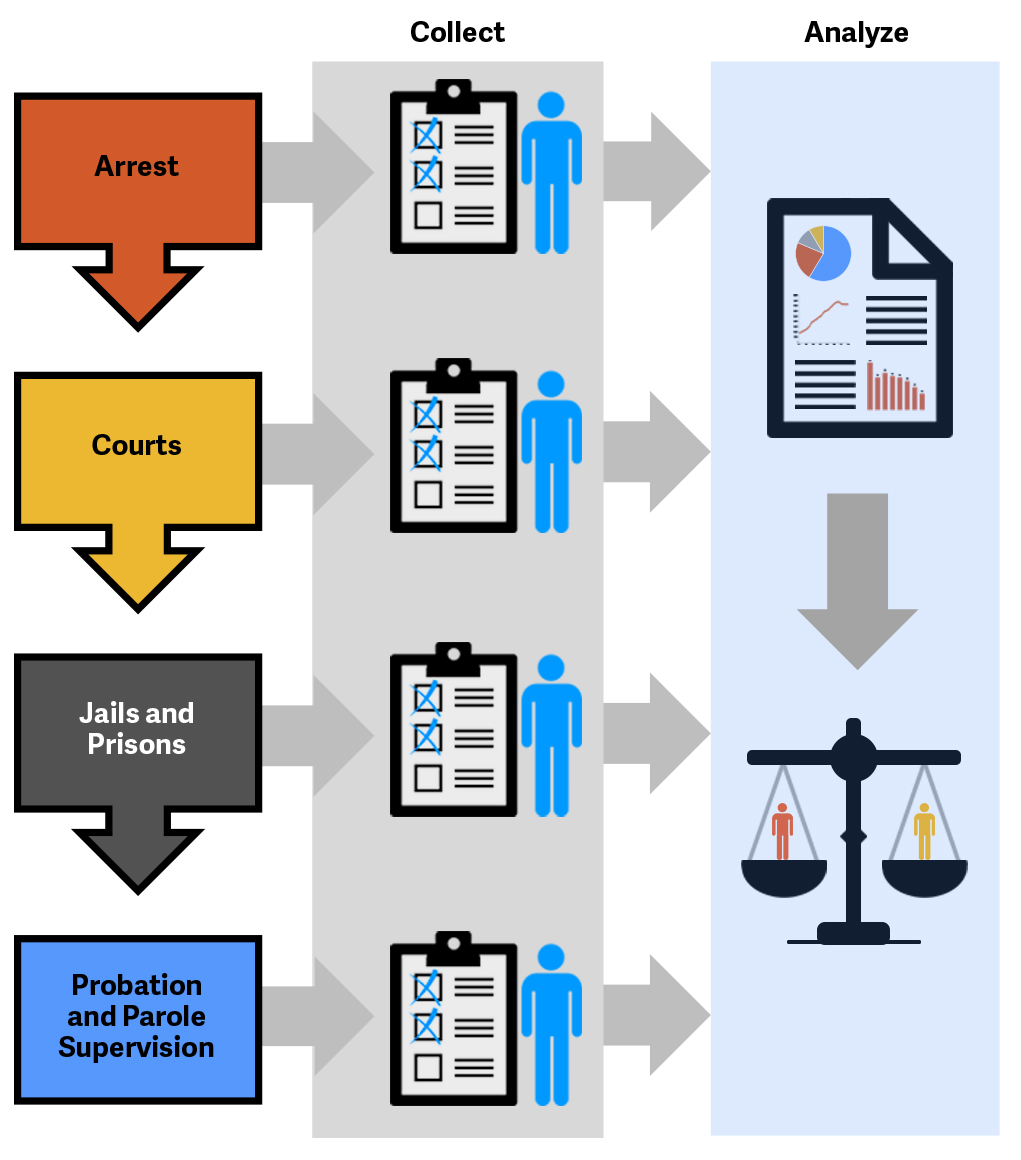
Demographic information can be collected at each stage of the criminal justice system and is critical to ensuring that people are treated fairly under the law.
Additional Resources
Racial and Ethnic Disproportionality in the Criminal Justice System
Racial and ethnic disproportionalities in rates of people who are victimized, arrested, and incarcerated compared with the general population are a significant concern for the public and officials sworn to treat people fairly under the law.
Yet national, state, and local data related to race and ethnicity suffer from inconsistent methodological approaches to the collection and interpretation of this data, which hamstrings researchers seeking to understand the causes of these disproportionalities across agencies and to what extent policies or practices exacerbate them.
Without comprehensive analyses of high-quality data and a thorough evaluation of related policies and practices, policymakers and criminal justice officials will continue to be frustrated in their attempts to respond to concerns about racial and ethnic disproportionalities and to make sure the justice system treats people fairly and equitably.
For information on how states report race and ethnicity data at arrest and for people in prison, and on probation, and parole supervision, see: The Alarming Lack of Data on Latinos in the Criminal Justice System.
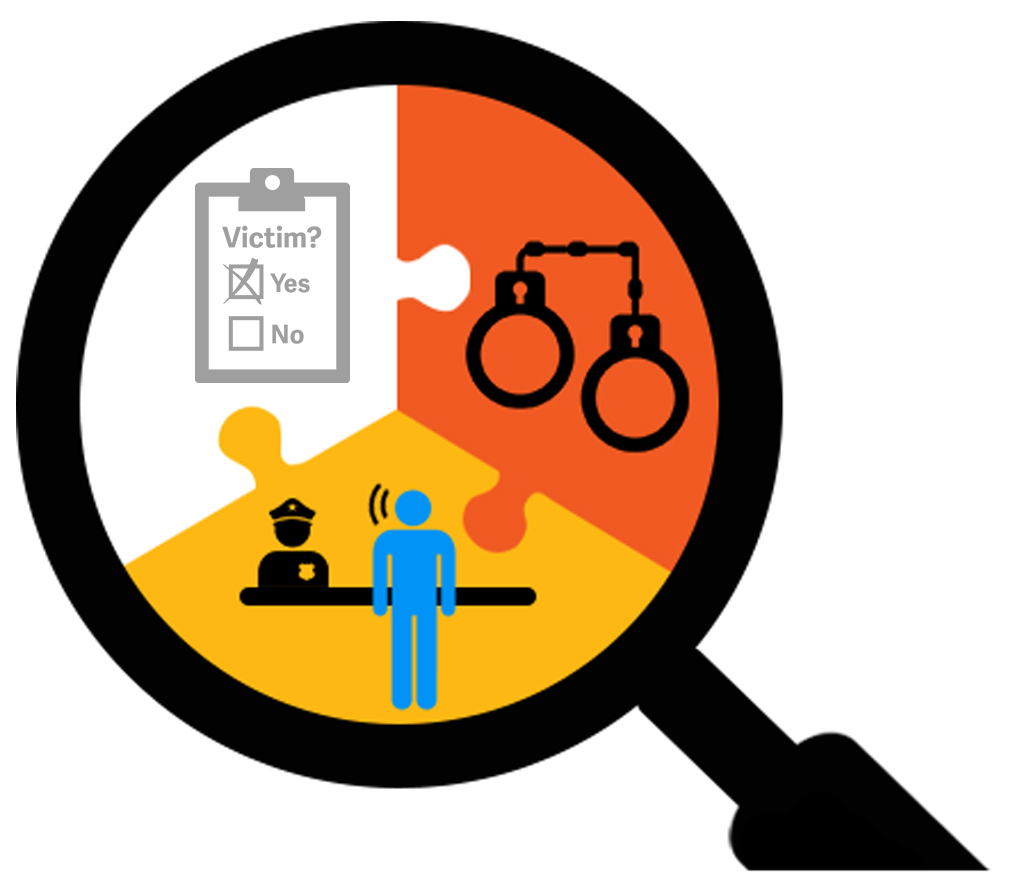
Victimization data is key to understanding how much crime goes unreported.
Case Study
States reduce barriers for law enforcement to participate in NIBRS
Several states have led initiatives to support greater law enforcement participation in NIBRS.
- The Oregon State Police published a NIBRS instruction manual for local departments and creates a quarterly newsletter containing updates on NIBRS implementation, opportunities for training, and clarifications on policy and procedure.
- Indiana requires in statute that local law enforcement agencies participate in NIBRS and that the Indiana State Police provide instruction for reporting data. The State Police invested in a data system that provides a central repository for real-time crime statistics that each agency can access to retrieve their own data or share with other agencies.
- In FY2016 and FY2017, the National Crime Statistics Exchange Initiative has provided funding to state and local law enforcement and public safety agencies across the country, including the Minnesota Department of Public Safety, the Nevada Department of Public Safety, and the Wyoming Bureau of Criminal Investigation, to enhance their capabilities to receive NIBRS data and to support local law enforcement agencies within the state to transition to NIBRS.
Case Study
Washington State collects data to address gaps in victims’ service
Washington State uses data on crime victim services to help providers address service gaps in two key ways. First, Washington’s Office of Crime Victims Advocacy (OCVA) and Department of Social and Health Services’ Children Administration jointly operate a statewide victim service data-collection system called InfoNet.[15] Providers use InfoNet to analyze the type and quantity of services in the state and identify gaps in services.
InfoNet’s key advantage compared to other reporting systems is its ability to fully capture the quantity and types of services that Washington provides to crime victims. InfoNet collects data and reports by different criteria, including type of crime, hours of services provided, number of contacts, and whether clients are new or ongoing.[16] Having access to this detailed information on a statewide basis allows providers to identify gaps in service and to use this information to inform grant solicitations, client outreach efforts, funding reports, and staff workload analyses.[17]
Second, Washington collected data on victim services from victims, victim service providers, and other stakeholders through a variety of methods, including in-person discussions and an online survey, as part of a statewide planning process to develop recommendations on using federal Victims of Crime Act (VOCA) funds through 2019, as outlined in its VOCA 2015–2019 State Plan.[18]
The Victims of Crime Act (VOCA) 2015–2019 State Plan represents another way that Washington uses data to address service gaps. This plan is a strategic document that OCVA developed based on victim services data from crime victims, service providers, law enforcement, courts, and other stakeholders.[19] It allocates new pass-through federal VOCA funding to specific areas of need that crime victims and service providers identified:[20]
- Funding for services: civil legal services including regional emergency legal services, sexual assault nurse examiner services, and therapy.[21]
- Funding for victims of specific crimes: assault, burglary, child abuse and neglect, child pornography, domestic violence, drunk or drugged driving, elder abuse, hate crimes, homicide, identity theft, robbery, sexual assault, stalking, trafficking, and vehicular victimization.[22]
[15] Washington State Department of Commerce, Washington InfoNet Statewide Data Report: July 1, 2015 through June 30, 2016 (Olympia: Washington State Department of Commerce, 2017).
[16] Washington State Department of Commerce, Washington InfoNet Statewide Data Report: July 1, 2015 through June 30, 2016.
[17] Ibid.
[18] “Victims of Crime Act (VOCA) 2015–2019 Plan,” State of Washington Department of Commerce, http://www.commerce.wa.gov/wp-content/uploads/2015/12/ocva-voca-state-plan-2015-2019-.pdf.
[19] Ibid.
[20] Ibid.
[21] Ibid.
[22] Ibid.
Case Study
Iowa works with service providers to meet victims’ underserved needs
On August 15, 2016, Iowa’s Crime Victims Assistance Division (CVAD) published the results of a study that assessed whether CVAD programs were responding to the needs of crime victims and victim service providers in the state.[23] The assessment was based primarily on a survey of service providers, and a series of focus groups and phone interviews with crime victims. Based on the findings of the study, Iowa prioritized a portion of the increase in federal formula VOCA Assistance funds for services provided to specific groups. These include victims in rural areas, refugees/immigrants, and LGBTQ-identifying victims, among others.[24]
CVAD also used the assessment results to drive its own statewide marketing campaign to inform members of the public about victim programming and services. Lastly, CVAD used the results of the study to develop a strategic plan for providing training and technical assistance to people in different professions (medical, mental health, law enforcement, etc.) who work with victims of crime.[25]
[23] Samantha Lowry et al., State of Iowa Victim Needs Assessment (Iowa: Attorney General’s Office Crime Victim Assistance Division, 2016).
[24] LGBTQ stands for lesbian, gay, bisexual, transgender, and queer.
[25] Samantha Lowry et al., State of Iowa Victim Needs Assessment.
Case Study
States improve reporting on demographic data for arrests
Some states are making progress in collecting and reporting demographic data.
- For example, Wisconsin’s Department of Justice has an interactive data dashboard that shows arrest data for adults and juveniles by gender and race.
- In 2015, Colorado passed the Community Law Enforcement Action Report (CLEAR) Act, which mandates that the Colorado Division of Criminal Justice (DCJ) annually analyze arrests, summonses, court filings, and parole decision data provided by law enforcement agencies, the Judicial Department, and the adult parole board. The CLEAR Act also requires that DCJ analyze the data by race/ethnicity and gender. To fulfill its mandate to annually report on its analysis to the legislature each year, DCJ created both an interactive data dashboard and an annual report showing criminal justice data associated with different decision points in the system, disaggregated by race, ethnicity, and gender.