Part 1, Strategy 1
Action Item 3: Enhance data sharing to improve public safety.
Why it matters
When law enforcement and supervision agencies, courts, jails, and prisons don’t share data, their ability to respond appropriately to people who commit crimes and who are victimized is impaired. Without data sharing, criminal justice agencies also are limited in their ability to conduct analyses to identify crime and recidivism trends. Only by updating systems so that information on crime, arrest, and victimization can be collected and shared among criminal justice agencies and with the public and policymakers, can state and local leaders ensure that resources are used wisely and people are held accountable for their criminal behavior.
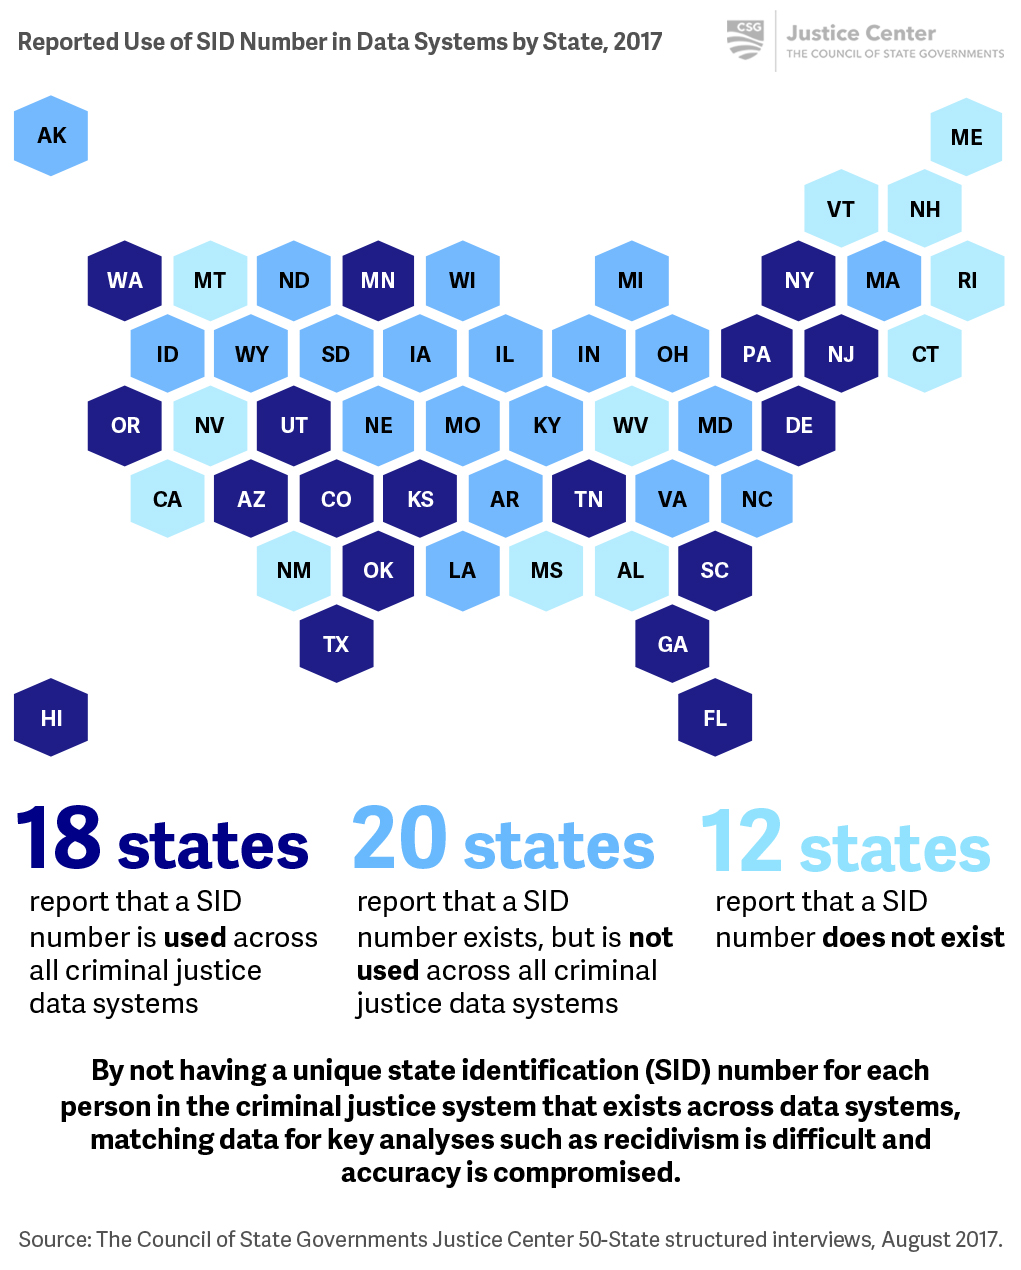
To improve data sharing, criminal justice agencies should use a unique state identification (SID) number across all systems to track a person’s movement through the entirety of the criminal justice system and determine whether a person returns. Using SID numbers can help ensure the most accurate matching across criminal justice data systems.
In addition to using a SID number, criminal justice agencies need to acquire technology that has the capacity to easily share information and establish processes to share data between agencies. With these components in place, all criminal justice agencies can access information that can help them improve how they respond to people in the criminal justice system, as well as analyze crime, arrest, and victimization trends over time to strengthen policies and practices that reduce recidivism, repair harm, prevent offenses, and build trust in communities.
What it looks like
- Require that a unique SID number be assigned to every person in the criminal justice system and be used universally.
- Ensure that criminal justice agencies have the capacity to share information and foster collaboration across agencies.
- See Case Study: North Carolina creates a database to share information across criminal justice agencies
- Require criminal justice agencies to publish aggregated criminal justice data online.
- See Case Study: States report on the extent to which people on supervision contribute to crime
- Provide state and local criminal justice agencies with access to research and recommendations on best practices.
- See Case Study: States make data more accessible
Key questions to guide action
- How are state and local officials coordinating to develop and implement strategies to reduce crime?
- What information do law enforcement and corrections regularly share?
- What percentage of people arrested last year were on supervision?
- What crime, arrest, and victimization data is regularly published online?
Use the information that follows to inform your answers to these questions.
Most states report not using a common ID number across criminal justice data systems, compromising a state’s ability to conduct key analyses.
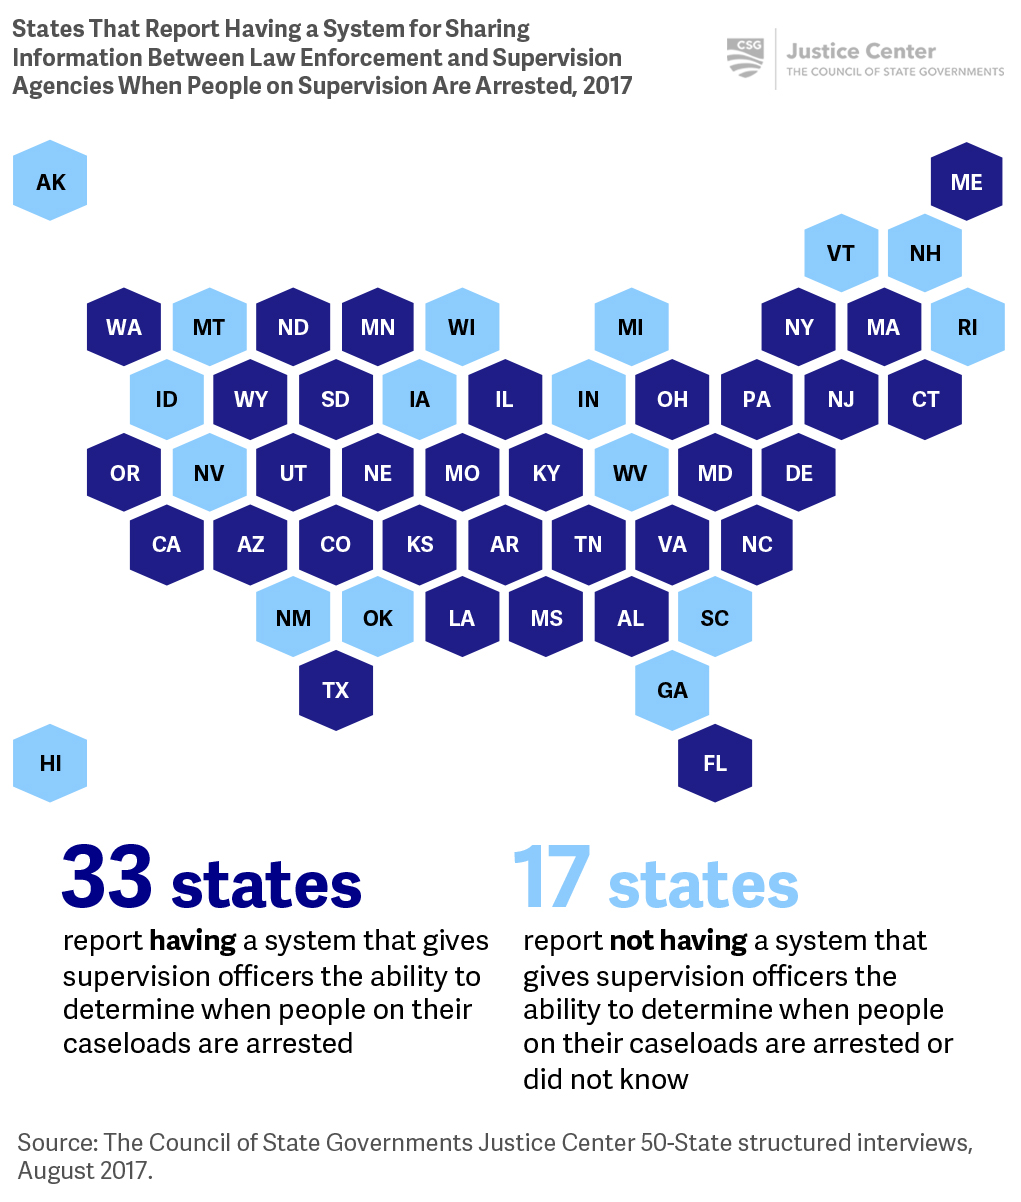
More than half of states report having systems that give supervision officers the ability to determine when people on their caseloads are arrested, but this is not necessarily done automatically.
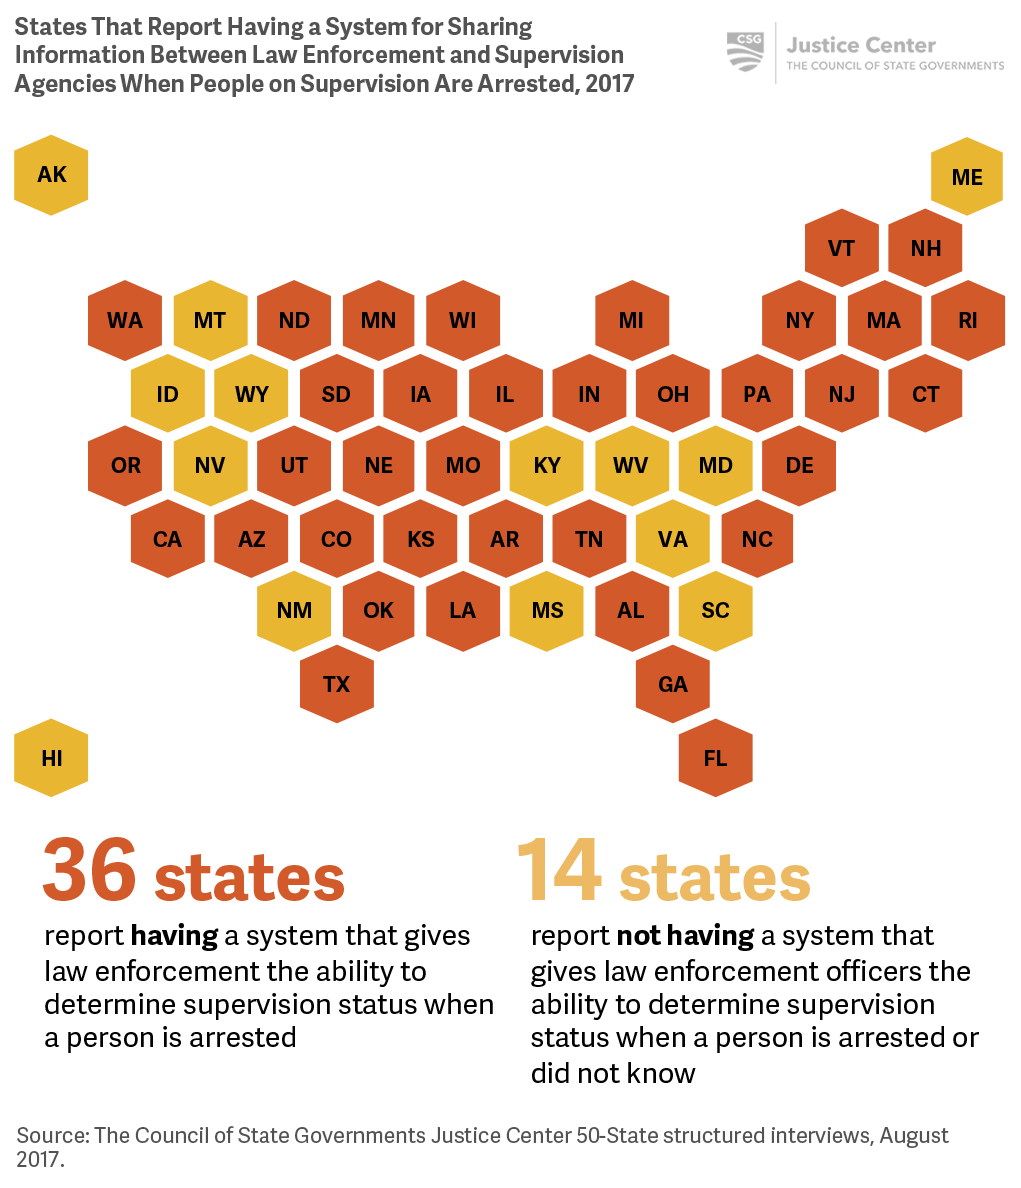
More than half of states report having systems that give law enforcement the ability to determine supervision status when a person is arrested, but this is not necessarily done automatically.
Case Study
North Carolina creates a database to share information across criminal justice agencies
Some states are creating mechanisms to share information across different criminal justice agencies. For example, North Carolina established the Criminal Justice Law Enforcement Automated Data Services (CJLEADS) database to serve as a centralized location for criminal justice agencies to access data that exists within the state’s various databases, including warrants; jail, court, and prison records; supervision status; and sex offender registration.
Case Study
States report on the extent to which people on supervision contribute to crime
One question that law enforcement and corrections officials often ask, but rarely can answer, is to what extent do people on probation and parole contribute to crime, as measured by arrests? Limited data sharing between supervision and law enforcement agencies and a lack of universal SID numbers makes this analysis difficult. Some jurisdictions, however, have data systems in place that enable them to answer this question.
New York’s Division of Criminal Justice Services annually publishes arrest reports on the number and percentage of arrests of people for misdemeanors and felonies who are on probation and parole supervision, both statewide and by county. The report also shows the number of arrests for felonies and misdemeanors and violent and drug offenses of people on probation and parole supervision. In 2016, people on parole and probation accounted for 2.8 percent and 4.7 percent, respectively, of all arrests statewide.[26] When police officers arrest someone who is on supervision, the law enforcement agency typically notifies the probation agency. New York City’s probation department uses the metric as part of its ongoing performance monitoring.
Even when agencies don’t share information regularly, states may be able to use data from different agencies to identify how people on supervision contribute to crime. In California, the chiefs of the Los Angeles, Redlands, Sacramento, and San Francisco Police Departments commissioned an analysis in 2010 to determine to what extent people on supervision contributed to crime. Researchers amassed more than 2.5 million adult arrest, probation, and parole supervision records maintained by 11 different agencies over a 42-month period stretching from January 1, 2008 to June 30, 2011.
The study found that people on supervision accounted for only 22 percent of total arrests between January 2008 and June 2011.[27] During that period, people on probation and parole supervision accounted for one out of every six arrests for violent crimes and for one out of every three drug arrests.[28]
In 2011, people on probation and parole in Michigan were rearrested at approximately the same rate within one year of their release—23 and 24 percent, respectively.[29] While the rates were similar, because the probation population was much larger than the parole population, people on probation contributed more than twice as much to crime and arrests than people on parole. Of all people who started probation and parole in 2011, approximately 3,500 people on probation were arrested for felony crimes within one year, compared to almost 1,500 people on parole.[30]
[26] New York Division of Criminal Justice Services, Parolee/Probationer Arrests Percent of Total Arrests Within County, 2007–2016 (Albany, NY: Division of Criminal Justice Services, March, 2018).
[27] The Council of State Governments Justice Center (CSG Justice Center), The Impact of Probation and Parole Populations on Arrest in Four California Cities (New York: CSG Justice Center, 2013).
[28] Ibid.
[29] CSG Justice Center, Applying a JR Approach to Improving Michigan’s Sentencing System (New York: CSG Justice Center, May 2014).
[30] Ibid.
Case Study
States make data more accessible
Jurisdictions across the country are taking steps to make their data more accessible for state leaders and the public by making information available online. Most often, state and local criminal justice agencies place reports summarizing crime, arrest, or supervision trends on their agency’s websites. Some states, such as Colorado and Pennsylvania, go even further by presenting this information with interactive graphics, while others, such as Washington, permit users to download data for individualized analyses. California created the OpenJustice data dashboard that explains key criminal justice indicators at the state and county level and provides users with the ability to download data for further analysis. In addition to showing crime and arrest trends, the website provides detailed information on deaths of people while in custody of law enforcement or a corrections agency, use of force by law enforcement, and demographic information about the victims of homicides.
States can also help local criminal justice agencies learn about best practices and share lessons learned from other jurisdictions. For example, the Oregon Knowledge Bank is a statewide resource that highlights innovative programs operating in the state, as well as research about policing, community supervision, and public safety programs.